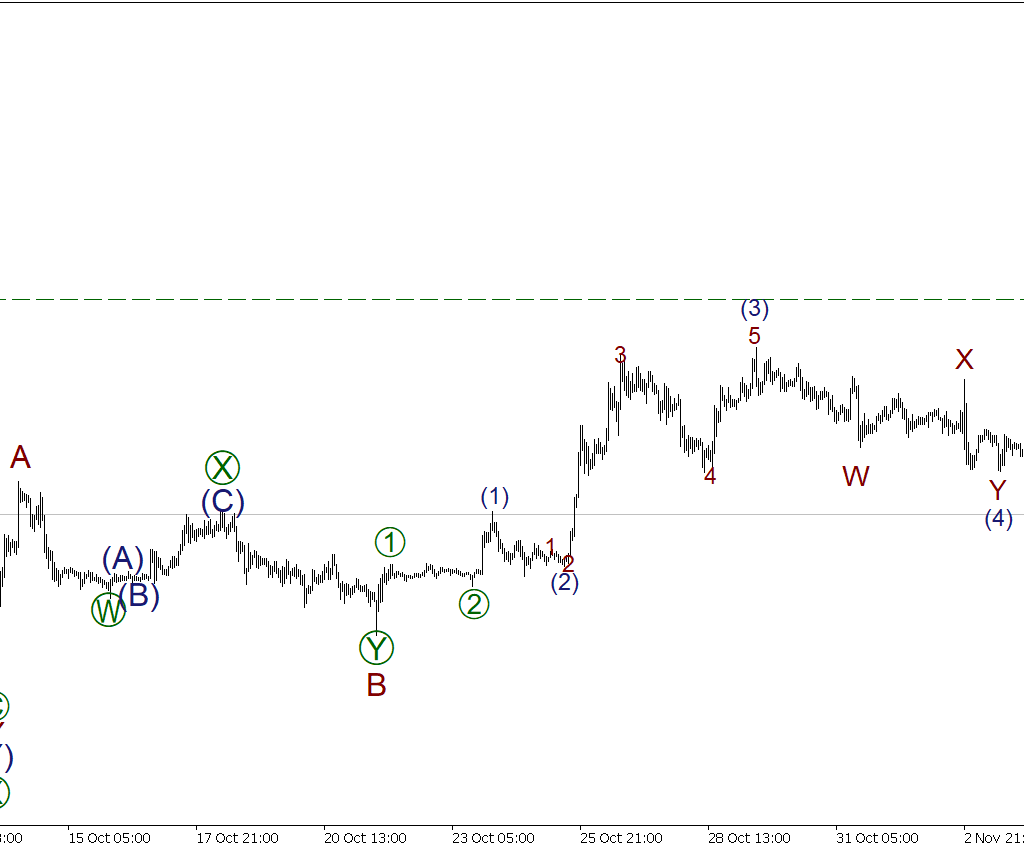
The hourly timeframe of the BTCUSD chart displays the formation of an actionary wave (W) as a standard A-B-C zigzag. Impulse wave A and correction B have been completed. Then the second impulse wave C began unfolding. Sub-waves [1]-[2]-[3]-[4] are completed within wave C. If the decline within the correction [4] is completed, the price may rise shortly towards the high of 21473.50 within wave [5]. This level was marked by a sub-wave [3].
Trading plan for BTCUSD today:
Buy 19667.00,
Take profit: 21473.50.
Myanfx-edu does not provide tax, investment or financial services and advice. The information is being presented without consideration of the investment objectives, risk tolerance, or financial circumstances of any specific investor and might not be suitable for all investors.
Go to Register with LiteForex Platform
Financial Trading is not suitable for all investors & involved Risky. If you through with this link and trade we may earn some commission.