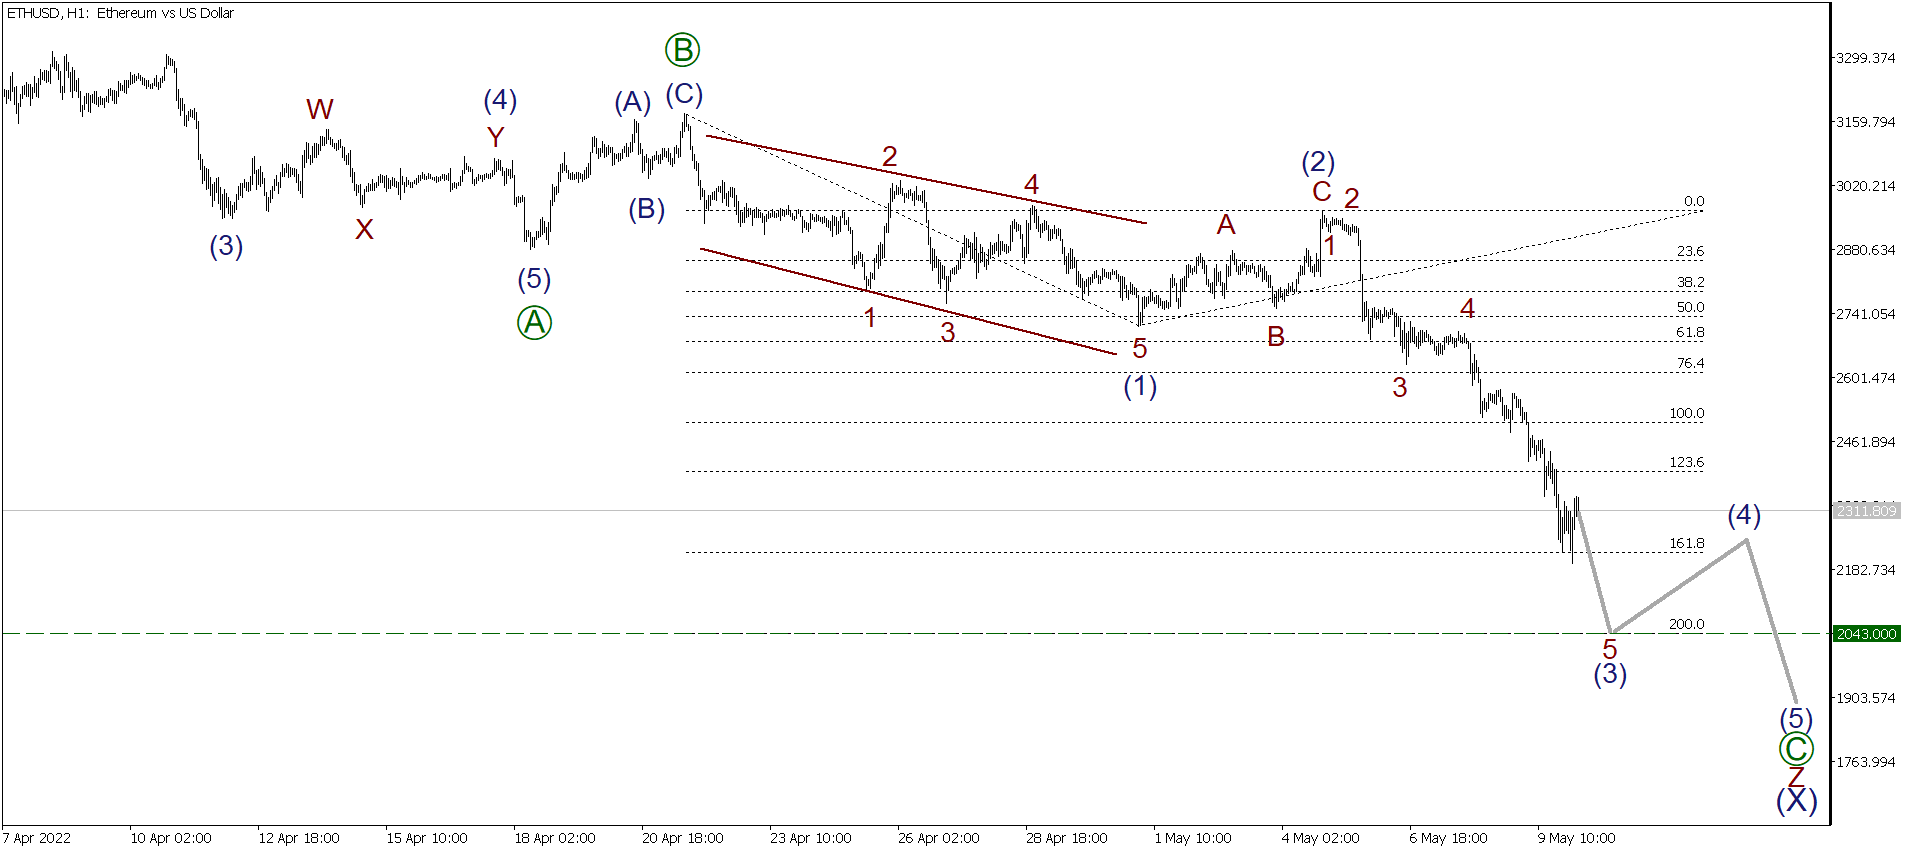
The hourly ETHUSD chart displays the structure of the bearish wave Z, the final wave of the large zigzag. Wave Z is unfolding as a simple zigzag [A]-[B]-[C], with the [A] impulse and the [B] correction completed inside. The final wave [C] is unfolding as an impulse (1)-(2)-(3)-(4)-(5). The price should be falling in sub-wave (3) to a level of 2043.00, where wave (3) will be 200% of wave (1). Next, the upward correction (4) could start developing, as outlined in the chart.
Trading plan for ETHUSD today:
Sell 2311.80,
Take profit: 2043.00.
Myanfx-edu does not provide tax, investment or financial services and advice. The information is being presented without consideration of the investment objectives, risk tolerance, or financial circumstances of any specific investor and might not be suitable for all investors.
Go to Register with LiteForex Platform
Financial Trading is not suitable for all investors & involved Risky. If you through with this link and trade we may earn some commission.