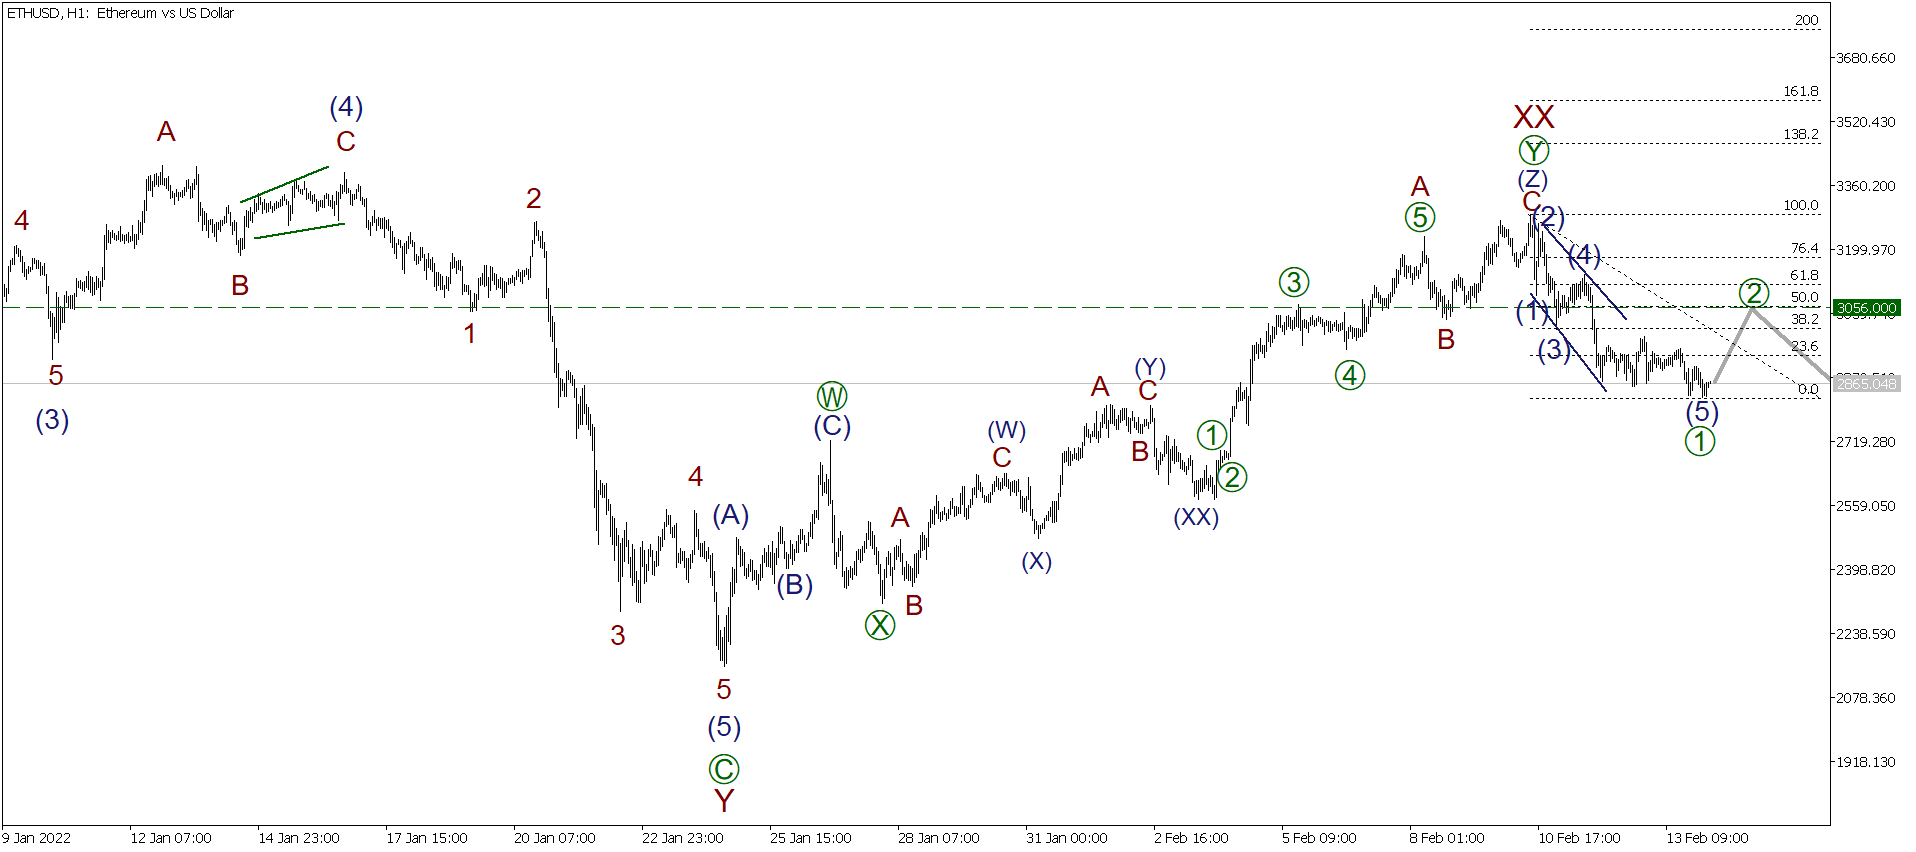
The ETHUSD chart displays the middle leg of the large corrective trend unfolding as a triple zigzag. The current chart displays the final part of the motive wave Y and the structure of the linking wave XX. The XX wave must have completed as a double zigzag [W]-[X]-[Y]. The most recent chart section shows the beginning of the bearish wave unfolding as an impulse. The first sub-wave of the potential impulse must have completed as a leading diagonal. The price should be rising in correction [2] to a level of 3056, where wave [2] will retrace wave [1] by 50%.
Trading plan for ETHUSD today:
Buy 2865.04.
Take profit: 3056.00.
Myanfx-edu does not provide tax, investment or financial services and advice. The information is being presented without consideration of the investment objectives, risk tolerance, or financial circumstances of any specific investor and might not be suitable for all investors.
Go to Register with LiteForex Platform
Financial Trading is not suitable for all investors & involved Risky. If you through with this link and trade we may earn some commission.