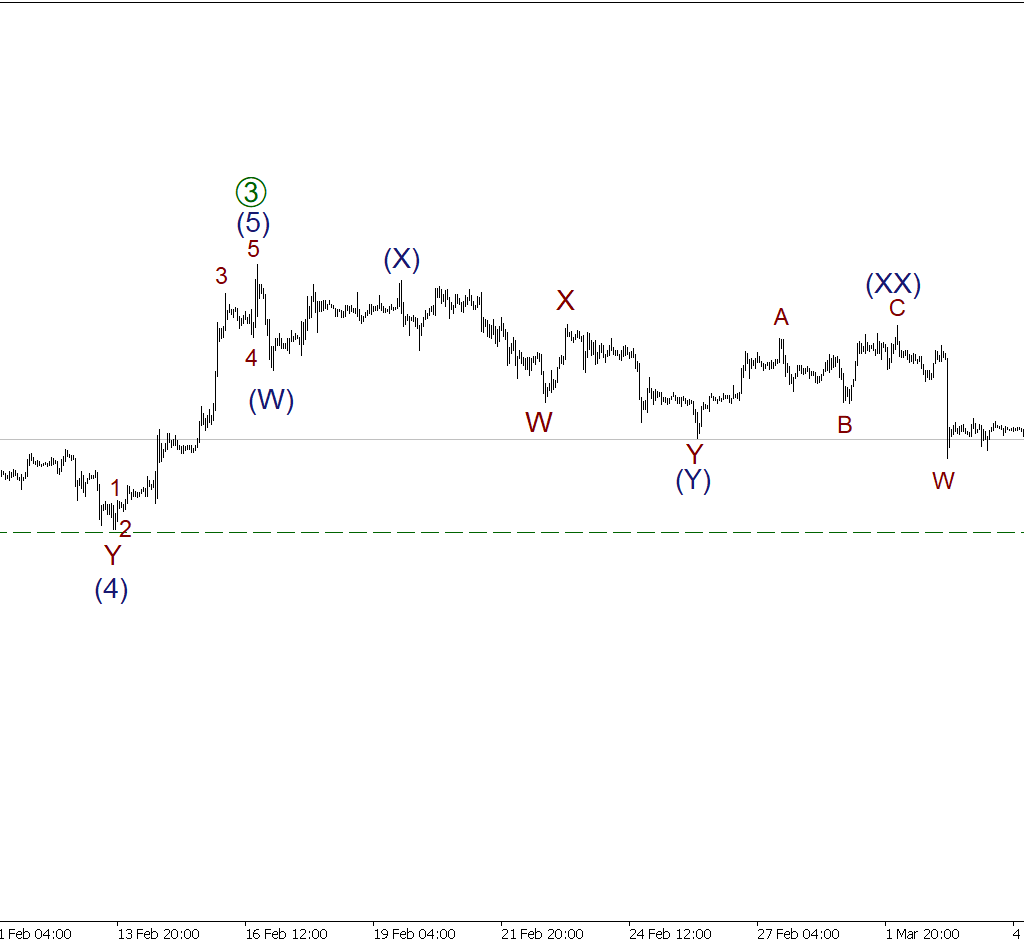
ETHUSD H1 timeframe shows that the market continues to build the upward wave A as the impulse [1]-[2]-[3]-[4]-[5]. After the impulse sub-wave [3] was completed, the price declined within the corrective sub-wave [4]. The structure of wave [4] is similar to the triple zigzag (W)-(X)-(Y)-(XX)-(Z), which requires the last sub-wave (Z) to look completed. The market may continue to decline to a low of 1459.29, marked by a corrective sub-wave (4).
Trading plan for ETHUSD for today:
Sell 1556.68,
Take profit: 1459.29.
Myanfx-edu does not provide tax, investment or financial services and advice. The information is being presented without consideration of the investment objectives, risk tolerance, or financial circumstances of any specific investor and might not be suitable for all investors.
Go to Register with LiteForex Platform
Financial Trading is not suitable for all investors & involved Risky. If you through with this link and trade we may earn some commission.